Caledonian Braves Study


Introduction
Football is one of the most popular sports in the UK and emissions from football clubs are undoubtedly high. We know that football clubs’ steadfast popularity is only accelerating from generation to generation. Using the carbon calculator, we have quantified carbon emissions for the Caledonian Braves.
Located in Strathclyde Country Park, Alliance Park is the home to the Caledonian Braves, a new Scottish semi-professional football team founded in 2019 by Chris Ewing, a retired pro-footballer and coach. Being a new team, the club has no specific identity, meaning they have no traditional business model and can shape their identity, values and future however they wish. With the surge of popularity of aiming for net-zero and sustainability, and with no current net-zero football club in Scotland, this is a goal they want to achieve and hence their affiliation with the University of Strathclyde. The following figure is taken from Google Earth showing the setup that the club currently operate in.
(Figure.1. Caledonian Braves)
The setup is quite simple. The circle represents a building, that the club uses for facilities whilst 1 & 2 represent two separate pitches and 3 is a car park.
Baseline - Emissions
As previously stated, due to lack of availability of field data, much of the audit data had to be estimated using reasonable estimations. Using scopes 1, 2, and 3, we have identified key areas that contributed to majority of emissions. From this we differentiated the emissions into three main pillars as shown in the following figure.
(Figure.2. Three Pillars)
And these are represented by the following:
-
Transportation – team/staff & fan travel
-
Utility – gas & electricity usage of stadium (including changing rooms)
-
Other – water usage, waste and equipment/kits
The audit can be seen in the figure below.
(Figure.3. Annual Carbon Emissions of Caledonian Braves)
From the figure, it can be identified that a total of 108,302 kgCO2 was calculated from the Caledonian Braves audit. In the figure, ''Transportation' produces most of the emissions at 66% for the club, whilst 'Utility' follows at 30% and 'Other' takes the remaining 4%. This is a trend which is typically found among other football clubs such as Fluminense, as previously mentioned in the literature review. The following figure demonstrates their emissions.
(Figure.4. Fluminese 2014 audit)
From the two figures, it can be identified that Fluminense has a greater 'Other' pillar, and this is due to the magnitude of the club which consist of a greater commercial and fan population.
Transportation
In detail, the Transportation audit consisted of four parts:
-
Players & staff away games
-
Players & staff to Alliance Park
-
Audience away games
-
Audience to Alliance Park
Players & staff away games
To assume the total emissions generated for this section, the total distance travelled from Alliance Park to the opposition home ground was calculated using google maps. To identify the away ground travel, the 20/21 season fixtures of just the Lowland League was used – as it can get quite complicated due to knockout rounds during cup games. With this in mind, we investigated the squad depth and staff that the club have which was found to be 21 players and 5 members of staff – we assumed that the club do not car-share and drive separately. As well as this, 0.1684 kgCO2/km was used for an average car, sourced from the UK government database. This can all be seen in the following figure which we used Microsoft Excel to capture the data.
(Figure.5. Lowland League 20/21 fixtures)
From the figure, it can be identified that a total of 9,706.71 kgCO2e were calculated for the away games travel of the Caledonian braves members.
Players & staff to Alliance Park
For this, we assumed a 6-mile average distance from players and staff homes to Alliance Park. This assumption came from calculating the area of Glasgow to be 68 square miles. Taking the length to be 8 miles, half of this would be 4 and the median of this would be 6, hence the assumption of 6 miles. When we visited Alliance Park, we met with the head coach of the team, Ricky Waddell, who told us the facility is operational 5 days a week and that the car park is almost always full, as there are no good transportation links in the area - we found 50 vehicles parked in the car park on our trip. It is important to note that this data also includes the sub-teams of the club such as the women’s and various youth teams. From this, we calculated a value of 42,285.54 kgCO2e for this section.
Audience away games
It was difficult to gather data regarding the number of fans due to the nature of this league, being a lower league meant that there was little coverage and demand for their game. Moreover, this league included teams such as Rangers and Celtic B who would host a drastically higher audience population than the rest of the league – fluctuating the data. For this reason, a value of 100 was assumed. For the fans, the estimation of the transportation type is more complex, and the corresponding percentages can be seen from the following figure, these were surveyed from the Campaign for Better Transport [1]. The associated CO2 factors can also be seen in the figure, sourced from the government website. Moreover, it is difficult to properly predict where the fans come from, for this reason the average value of the distance for the player’s away games was taken and found to be 38.27 miles. The total was calculated to be 16,758.79 kgCO2e, which is higher than the club’s away games values which is as expected as there are more fans.
(Figure.6. Audience away game calculations)
Audience to Alliance Park
The audience home game travel followed a similar calculation and can be seen from the following figure, however with a few tweaks. First, the same average distance of 6 miles was used as we assume the fans would be local and from around the Glasgow area. The total for this section was calculated to find 2,714.31 kgCO2e which is a lot lower than the club’s home games. This is due to the size of the club, if the club was playing in a higher league, this section would be the highest due to the number of fans.
(Figure.7. Audience home game calculations)
Total
The following graph displays the comparison of the audited sections. As previously discussed, the players and staff to alliance park, which includes home & training contains the largest emissions at 59%. An additional important factor to this section would be 1.7% of the 59% consists of the home games from a league season, whilst the reminder consists of the training of various sub-teams and the senior team. Second largest is the audience away games at 23% and 14% for the players & staff away games. Lastly, 4% consists of the audience home game attendance.
(Figure.8. Comparison of travel)
Utility
Calculating the total emissions from utilities under scope 2, considered the following:
-
Space heating
-
Hot Water
-
Lighting
-
Other Appliances
Space Heating and Hot Water
Gas was found to be the source for space and water heating for the building, and the area was found to be 5109.4 sq.ft. using Google Maps and the standard energy consumption for heating in the UK per year is 133 kWh per sq.ft [2][8]. From this, we calculated 63,127.80 kWh2 energy consumption by heating in this building, and water consumption for showering as 1.4 million litres [5]. Assuming the average temperature of water as 15°C and hot water as 55°C, we got the energy consumption for water heating as 67,925 kWh. The total energy consumption for daily showering with average temperature of 55°C was found to be 225 litres per person.
Lighting
In the case of lighting, energy consumption is considered for the lights inside the building and flood lights outside. We assumed 100 CFL lights rated at 60 W which were used for 12 hours a day. From the Google Earth, the area of the pitch was found to be 7140 m2 - 105x68 m, is standard size of the field [3]. Industry practice for training and recreational purpose is 200 Lux. From this data, we calculated lumen requirements to light up the field to be 1,428,000 Lumen, by assuming and dividing 150 Lumen/Watt, we calculate a total wattage for field to be 9,250 Watt [2]. Having 15 flood lights, we assumed incandescent flood lights use 1,000 Watts each for 7 hours during longer nights and 4 hours during long days. If they use 15 1000-Watt flood lights, it give a total of 15000 Watts [4]. It can be consumed more energy and less energy efficient as standard football stadium needs 9250 watts only [2]. Total energy consumption is 35,136 kWh including lighting of both building and field.
(Figure.9. Comparison of utility)
From the graph above, the gas demand is greater than the electricity demand, being 73% of the total utility. The main purpose of the building is to have changing rooms and an area for physiotherapy for players. This explains the high demand of heat. Lighting is self-explanatory. From 35,136 kWh energy consumed, 7,384 KgCO2 was emitted. Appliances are from the mains and electronics such as computers. In total there were 32,698 kgCO2 of carbon emissions, 38% from hot water heating whereas only 4% from small scale office appliances.
Others
This section is classified in to four respectively:
-
Water Supply
-
Food
-
Clothing
-
Waste
Water Supply
For general water supply, average use of office water consumption in a year is 50 litres per employee [16]. Considering 5 working days a week, in one year with 50 employees, water consumed per year is 0.65 million litres. We assumed that 25 players in 260 working days take 15 minutes for showering, using 15 litres of water per minute. [9] We concluded that 1.465 million litres of water was used for showering.
Food
We assumed that 100 fans come per match, considering only 70% of them buy a pie/sandwich and a 0.5-litre bottle of water during the game. Thus, total food consumption is 45.5 kg, which led to 168.41 kgCO2 of emissions produced on a match day. This number equals 2863.04 kgCO2/annum.
Clothing
In case of materials used in the club, we considered 21 players each using sportswear weighing 475 grams [13][10]. We also assumed that kits are only worn for a single year, with each player needing three kits for: training, home and away, which in total weighs 29.92 kg, emits 667.63 kg of carbon dioxide.
Waste
In the club, we assumed only packaging waste, such as pie wrappers and plastic bottles, not food waste since this is difficult to quantify. We assumed that 90 packets of crisps would be sold and that 75 people bought pies per game [14]. Total drinking bottles sold as 200, assuming 35 bottles of 1.5 litres, 45 bottles of 0.25 litres, 50 bottles of 0.33 litre bottles and 70 bottles of 0.6 litre, respectively. By calculating wrapper papers, crisp packets, and bottle waste, we got total waste per week as 3.5 kg which results 293 kg waste per year. Since the quantity of waste from the football club is exceptionally low, the best option is to transfer this waste to the nearest waste recycling centres over alternatives.
(Figure.10. Comparison of Other)
The lowest emissions are from ‘Other’ including water supply/treatment, food, clothing, and waste. From the above-illustrated graph, it shows that a total of 4139 kgCO2 emits from water supply, food, clothing, and plastic waste. The graph illustrates 69% of emissions from food per year considering that there is 45.5 kg of food being wasted per match. Assuming the average showering time as 15 minutes, 8% of carbon emissions is through water usage. The Caledonian Braves currently, have three kits per player (training, home and away) for their team of 21 players, this contributing 16% of the emissions to clothing. Assuming the plastic bottle and food wrapper waste per year as a total of 293 kg, the graph demonstrates 7 % of the total carbon emissions from general waste.
Improvements
As previously mentioned in the methodology, the pathway set is to: avoid, improve then renewable implementation was considered for improvements.
Transportation
There are three ways to reduce emissions from transportation on weekdays which are sustainable, such as cycling and walking. This can be possible for players and staff members to do, while traveling back and forth from training. Car-pooling with a minimum of four people is economically feasible and easy to implement with effective cuts in carbon emissions of 50%. If half of the club members transition to electric vehicles; it would reduce the carbon emissions by 20%.
(Figure.11. Improvements for training)
For away games, we calculated the number of emissions, using a hired coach as suggestion one and car-sharing as suggestion two. Both are suitable methods to reduce carbon emissions if the players utilise the suggestions during away games. From the following graph, it shows that carbon emissions can fall by 84% if the team uses a hired coach.
(Figure.12. Improvements for club away matches)
Utility
For ‘Utility’ improvements, suggestions are solar thermal PV (photo voltaic) for heating water during showers, low-flow showerheads to lower heating, and reducing shower time, respectively. These three suggestions can be implemented together to further reduce carbon emissions. From figure.14 below, the three suggestions are focused on reducing the carbon emissions associated with the use and heating of hot water. Suggestion 1 incorporates solar thermal PV panels, and this was simulated by using Helioscope. Figure.13 below demonstrates the area selected to host the panels on the building of the club. As well as this, an excel sheet is attached below which has the formulae required to calculate payback. From this study, we found that this setup can reduce carbon emissions by 22%.
[CLICK FOR SOLAR DOWNLOAD]
Prices of solar systems are dependent on the installer and therefore prices may vary. The cost of installation that we used, were sourced from greenmatch.co.uk. If they reduce their showering time from 15 minutes to 12 minutes, the carbon emission from ’Utility’ falls to 20%. Considering suggestion three as reducing low-flow showerhead time, it is also a good method to reduce carbon emissions by 52% from hot water.
(Figure.13. Solar deployment on building)
(Figure.14.Improvement for hot water - gas)
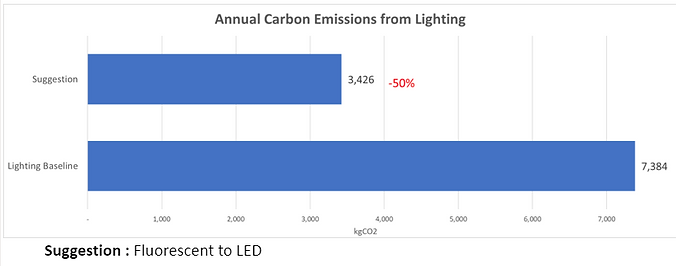
(Figure.15. Improvement for lighting - electricity)
By changing Building lights from CFL to LED lights, it would lower the carbon emissions by 50% (figure.15). Comparing CFL lights against LED’s lifetime and lumen, highlights the increased efficiency of LEDs vs CFLs [15]. Considering the flood lights, 1000-watt incandescent bulbs can be changed to 700-watt LED bulbs, which will be more efficient and save energy. For both the lighting and low-flow showerheads the costs are relatively low compared to PV.
Others
For improvements on ‘Other’ emissions, there are a couple of emission-releasing activities that were focused on. Firstly, emissions from water supply can be reduced by two suggestions, reducing showering time and moving to low-flow faucets. As the graph below, 44% of carbon emissions can be cut by lessening the showering time of the players. However, controlling time might be a practical limitation. Thus, despite little investment, changing to low-flow faucets can reduce the water consumption per minute by up to 60%, this can critically decrease around two-thirds of emissions from the water supply [16].
(Figure.16. Improvement for water supply - 'Other')
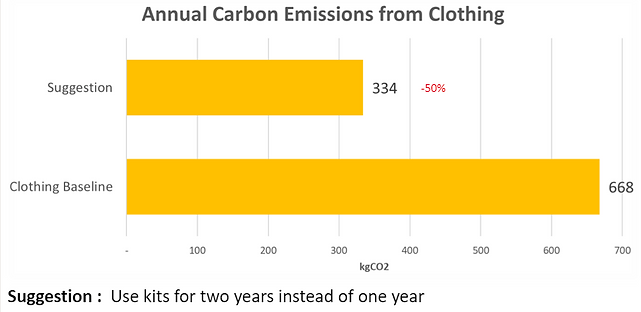
(Figure.17. Improvement for clothing - 'Other')
Secondly, the above-mentioned graph illustrates that the duration of usage for the kits can be altered from one-year to two-year use. For instance, if they use the kits for two years, the annual carbon emissions associated with clothing will be halved.
(Figure.18. Comparison of before and after)
With the best suggestions that fit for each scope, the changes of annual carbon emissions are illustrated by the above bar chart. It is clearly presented that the Caledonian Brave’s carbon footprint can be tackled by utilising these methods. Emissions from 'Transportation' was reduced by 41%, this tackles our main source of emissions, the same reduction is applied in emissions for ‘Utility’, and following with the smallest impact is ‘Other’ emission sources with 13% decreasing. Whereas overall reduction of the carbon footprint is 40%, which equals 43,111 kgCO2.
Celtic F.C.
Any club's dream is to scale up their game and that comes with an exponential increase in infrastructure and development, unfortunately this also means higher emissions. Here we scale up our model for Celtic F.C, a Scottish professional football club based in Glasgow, which plays in the Scottish Premiership. The emissions projected based on informed assumptions proves the impact is massive.
(Figure.19. Comparison of Celtic F.C. & Caledonian Braves)
Baseline
The difference is evident especially in the food and utilities, the breakdown can be observed from the tables.
(Figure.20. Annual emissions of Celtic F.C.)
Table 1 – Breakdown of total carbon emissions
(Note: All estimations are approximations based on data available online and extrapolations based on general trends in football and exclude air travel and international and national business and marketing activities of the club)
(Figure.21. Percentage breakdown of primary sources)
But fortunately, the methodology and the pathway to net-zero remains the same and the capability of the calculator to step up and obtain results for a club playing in premiership is encouragement for any to use this model.
The same can be employed for any organisation successfully for carbon emissions estimation and successful reduction strategies.
References
[2] Haynes, R. (2020). How Many Powers are Needed to Light up a Football Field? [online] TACHYON Light. Available at: https://tachyonlight.com/how-many-powers-are-needed-to-light-up-a-football-field/ [Accessed 17 May 2022].
[3] earth.google.com. (n.d.). Google Earth. [online] Available at: https://earth.google.com/web/search/caledonina+braves/@55.80010988 [Accessed 17 May 2022].
[4] www.tlc-direct.co.uk. (n.d.). Polo Range Bulkheads. [online] Available at: https://www.tlc-direct.co.uk/Main_Index/Lighting_Menu_Index/Bulkhead_Internal_Index/Polo_Bulkheads/index.html [Accessed 17 May 2022].
[5] www.tlc-direct.co.uk. (n.d.). TLC Electrical Supplies. [online] Available at: https://www.tlc-direct.co.uk/ [Accessed 17 May 2022].
[6] Meat, C. (n.d.). Buy Fresh Scotch Pies Online. [online] Campbells Prime Meat. Available at: https://www.campbellsmeat.com/product/scotch-pies-12.html [Accessed 17 May 2022].
[7] Energy use in offices ■ OFFICE TYPE 1 Naturally ventilated cellular ■ OFFICE TYPE 2 Naturally ventilated open-plan ■ OFFICE TYPE 3 Air-conditioned standard ■ OFFICE TYPE 4 Air-conditioned prestige ARCHIVED DOCUMENT. (n.d.). [online] Available at: https://www.cibse.org/getmedia/7fb5616f-1ed7-4854-bf72-2dae1d8bde62/ECG19-Energy-Use-in-Offices-(formerly-ECON19.
[8] www.ovoenergy.com. (n.d.). How much energy do you use to heat your home, and what’s the cost? | OVO Energy. [online] Available at: https://www.ovoenergy.com/guides/energy-guides/how-much-heating-energy-do-you-use.
[9] Waterwise (2021). Save Water – Waterwise. [online] Waterwise. Available at: https://www.waterwise.org.uk/save-water/.
[10] www.fgr.co.uk. (n.d.). Welcome to the greenest football club in the world. [online] Available at: https://www.fgr.co.uk/.
[11] www.strath.ac.uk. (n.d.). Project websites | University of Strathclyde. [online] Available at: https://www.strath.ac.uk/research/energysystemsresearchunit/courses/projectwebsites/ [Accessed 17 May 2022].
[12] GOV.UK. (2021). Greenhouse gas reporting: conversion factors 2021. [online] Available at: https://www.gov.uk/government/publications/greenhouse-gas-reporting-conversion-factors-2021.
[13] Carlile, C. (2019). The carbon cost of clothing | Ethical Consumer. [online] Ethical Consumer. Available at: https://www.ethicalconsumer.org/fashion-clothing/carbon-cost-clothing.
[14] ResearchGate. (n.d.). Table 1 : Average and median weight of plastic Bottles. [online] Available at: https://www.researchgate.net/figure/Average-and-median-weight-of-plastic-Bottles_tbl1_324151712.
[15] https://www.tlc-direct.co.uk/Main_Index/Lighting_Menu_Index/index.html?
[16] Making your business watertight. (n.d.). [online] Available at: https://www.south-staffs-water.co.uk/media/1509/waterusebusiness.pdf.